Our client based out in the United States specializes in creating training courses for different job roles in a hospital which include doctors, nurses and others. They wanted us to build LearnDash reports in a way that shows performance of a student across 9 sub categories and also aggregate on 3 broad categories. And based on the results, the Group Leader would assign additional training where they felt the students needed improvement.
Specialized Reporting for LearnDash: A Case Study on Custom Question Category Reports
We developed a custom LearnDash reporting plugin for a company that specializes in providing training for hospital staff to allow them to generate a report based on the different categories of questions assigned.

Client Background & Requirements
How did we provide a solution?
By default, LearnDash offers a standard report for the quiz attempted by the student which is fine for most people. But our client wanted to generate a report which shows how a student performed across different categories of questions. So, the student can check that result and improve their performance in that category.
We proposed a solution by developing a custom LearnDash plugin and LearnDash quiz customization that will pull data from the LearnDash and create a custom view that will show quiz reports based on question categories. We worked on following modules:
1. Custom Quiz Categories
- The client wanted a report based on 3 broad question categories each of which has 3 sub categories. So total 9 categories in total.
- So, we created 9 categories in total using the ACF plugin and added it to the LearnDash Quiz’s question custom post type. Once this was done, we tagged all the questions in their quizzes to their respective categories.
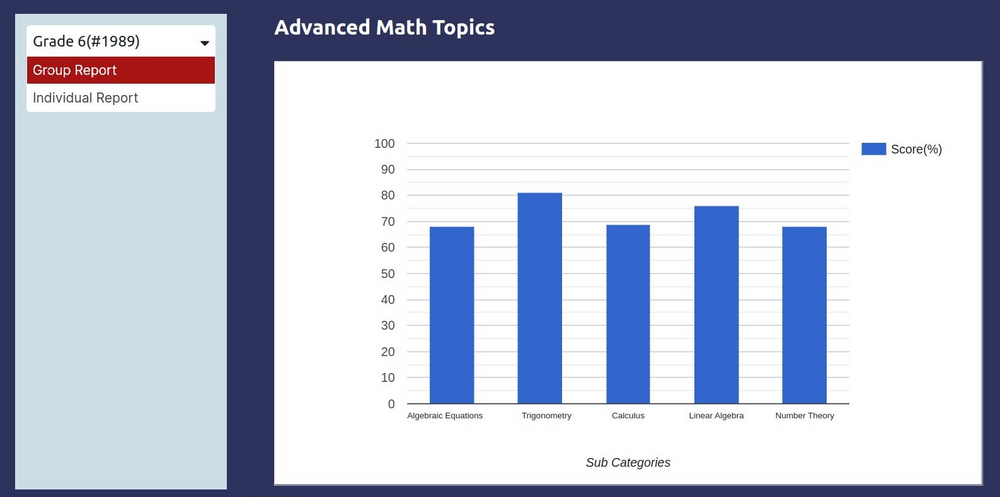
2. Admin Level Report
- This admin level report was meant for the company that enables them to track all the groups and to see how all the groups of students enrolled on their site are overall performing.
- The administrator by default sees a list of all groups and the overall aggregate category score of all the groups. The admin can then choose to click on any particular group to see their overall category score and normal score.
- They can then click on ‘Individual Report’ to see scores of all the individuals in the Group. This view is similar to the Group Leader report described earlier.
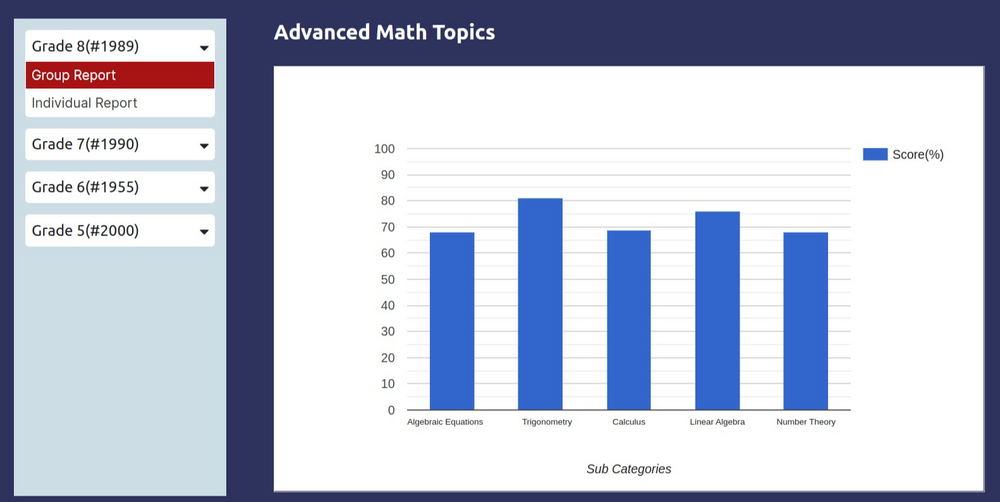
3. Group Leader Report
- This report was specifically developed for Group Leaders to track their students and measure their overall performance. In the Group Report View, the Group Leader would first see group level aggregate reports for each group they have been assigned.
- And then when they click on any particular group, they see a list of all students in that group and their overall aggregate score. The Group leader can see the overall category-wise performance of the student and then click on ‘Detailed Report’ to get a quiz level category and normal report for that particular student. This is the same view where the student sees the report for themselves.
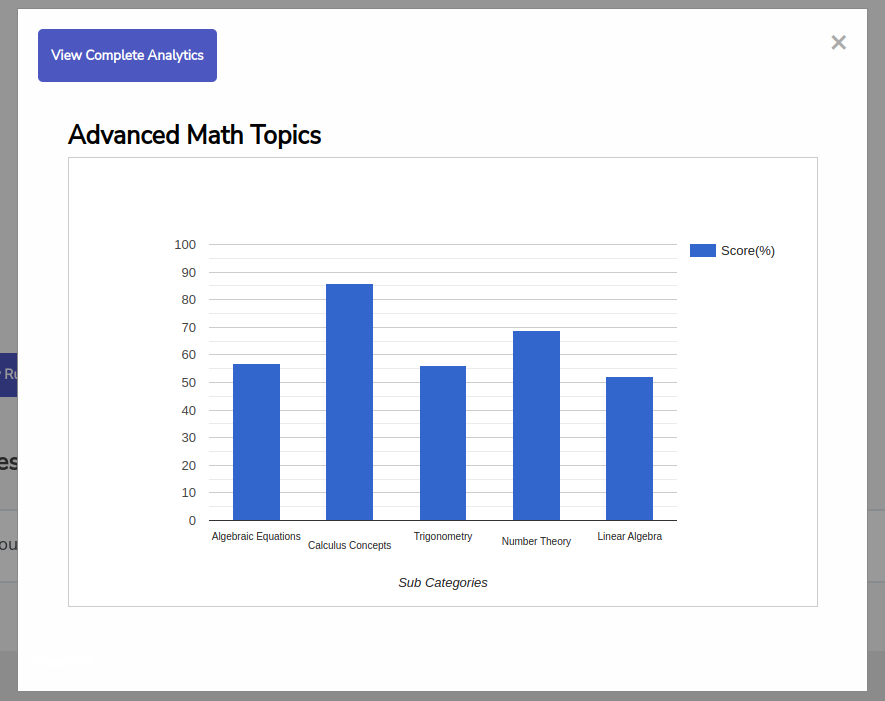
4. Individual Student Report
- The client wanted a custom view where students can go under ‘My Profile’ and check this category-based report for themselves after attempting a quiz. So, we created a custom section that shows results to the student. In the student view, the students first see their overall category aggregate score at first.
- And then, they can click on any particular quiz among the list of particular quizzes that they have attempted to get a category-driven report for that particular quiz.
- So, this helps students to see what category they are performing good in overall and helps them drill down to a particular quiz where they performed poorly.
So, in this way we offered a complete new category-driven report that enabled our client to view category based performance and evaluate students accordingly.