Our client is an educational company based in the United States that develops educational products for school children. They wanted us to develop a custom Reporting plugin for LearnDash that would show Group Reports based on the categories assigned to a question which enables them to evaluate an individual or a group’s performance on a topic / lesson level.
Customized LearnDash Reporting: Tailored Group and Individual Performance Insights
We developed a custom LearnDash Reports plugin for a client that enables them to analyze student performance in tests segmented by the categories of the questions attempted.

Client Background & Requirements
How did we provide a solution?
We developed a custom quiz reporting addon for LearnDash that displays Group level reports to Group Leaders based on LearnDash question’s category and also allows them to download it in XLSX format if they wish to. The solution had following modules :
1. Group based Student Report Functionality
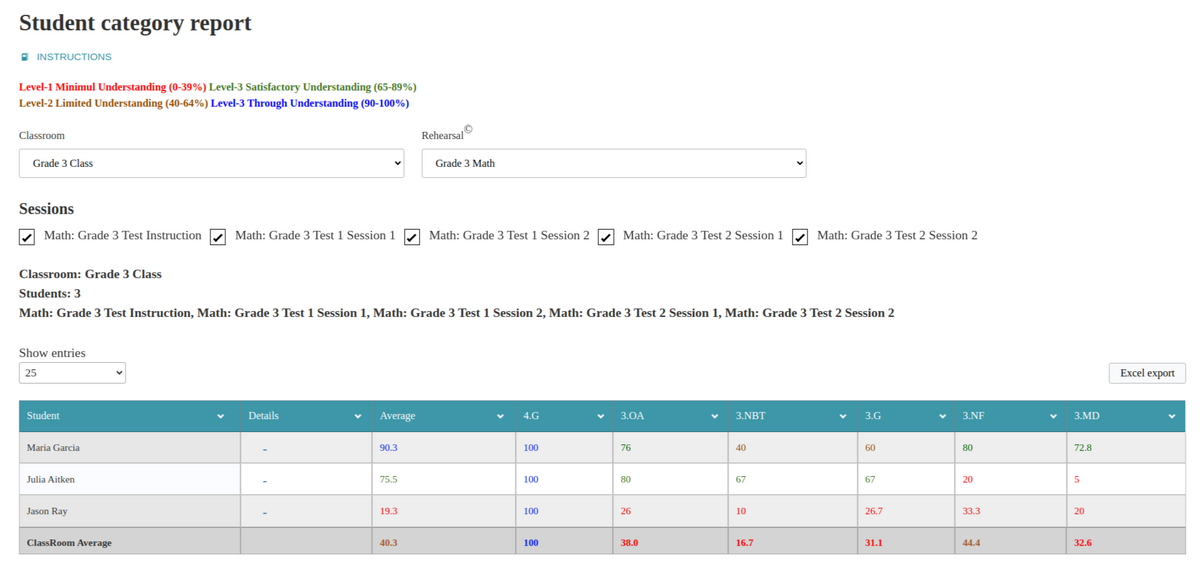
- We developed a shortcode on the frontend that allows the teacher (Group Leader) to view the category based score of the students in a class (Group)
- The teacher first has to select the Group and the tests (quizzes) she would like to see the results for.
- Every question in these tests is pre-assigned a category for every lesson. For example, Quadratic Equations will be 1.A, Trigonometry will be 1.C, and so on.
- When a teacher selects a class, all the tests attempted by that class will be populated in the tests’ dropdown.
- Now the teacher has to select the test, she wishes to see the result for and then on AJAX request all the results of the students in that class are populated.
- Instead of seeing a simple result of how much a student scored in a test, the teacher will see a row of category-driven data depicting how much each student scored in that quiz for each of the categories.
- Besides, we also calculate the aggregate score of all the students in the class in each category, so teachers can compare individual students with the class aggregate.
- Additionally, the client wanted us to show results in different colors so it is easier for teachers to identify what students are performing well and which aren’t.
- So, let’s say for someone who scored only 20% in a category will be shown in Red, someone who scored above 60% will be in green and above 90% will be in blue
- To make this table sortable and searchable, we developed it using jQueryDataTable.
2. Individual Student Report Functionality
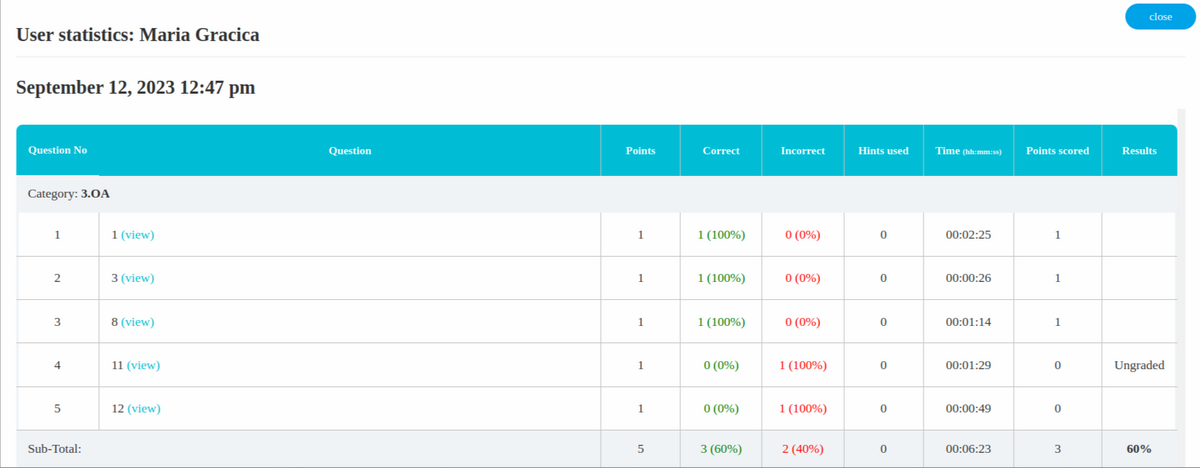
- Once the teacher has seen the category-driven report, she might be also interested to see the particular questions in the quiz the student got wrong.
- So, we added an additional column which had a button. When this button is clicked it will show a popup to the teacher showing the entire result of the entire quiz question-by-question, so teacher can get a quick idea on what questions the student got wrong
- Additionally, we added a functionality where teachers can print this report if they wish to.
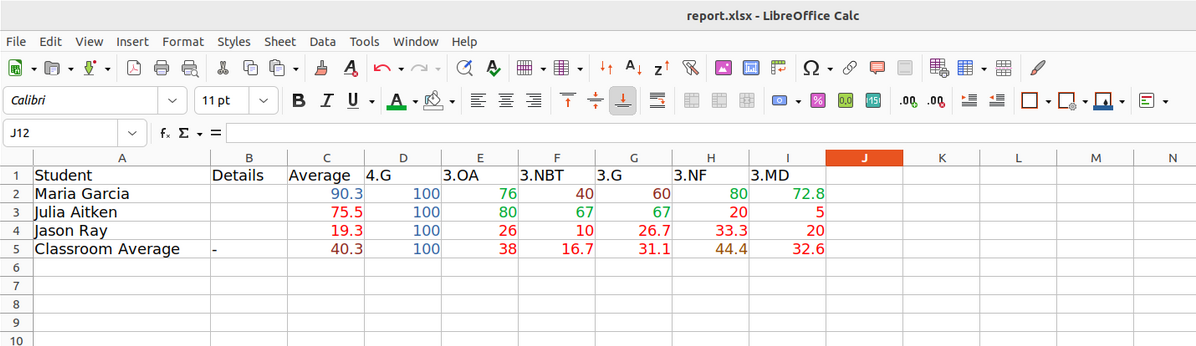
3. Excel Report Export with Color Coding
- We added a functionality, where a teacher can export the entire class report currently being viewed into an XLSX file along with the color coding.
- This allows them to share reports with other stakeholders and even print them for future references if required.